Monitoring
Using IBM Cloud Monitoring with Sysdig
Sysdig monitor is a third-party cloud-native container-intelligence management system. You can use this to gain operational visibility for your applications, services, and platform. Sysdig offers administrators, DevOps teams and developers advanced features to monitor and troubleshoot, define alerts, and design custom views.
Create a Sysdig service instance
- Switch to your personal IBM Cloud account.
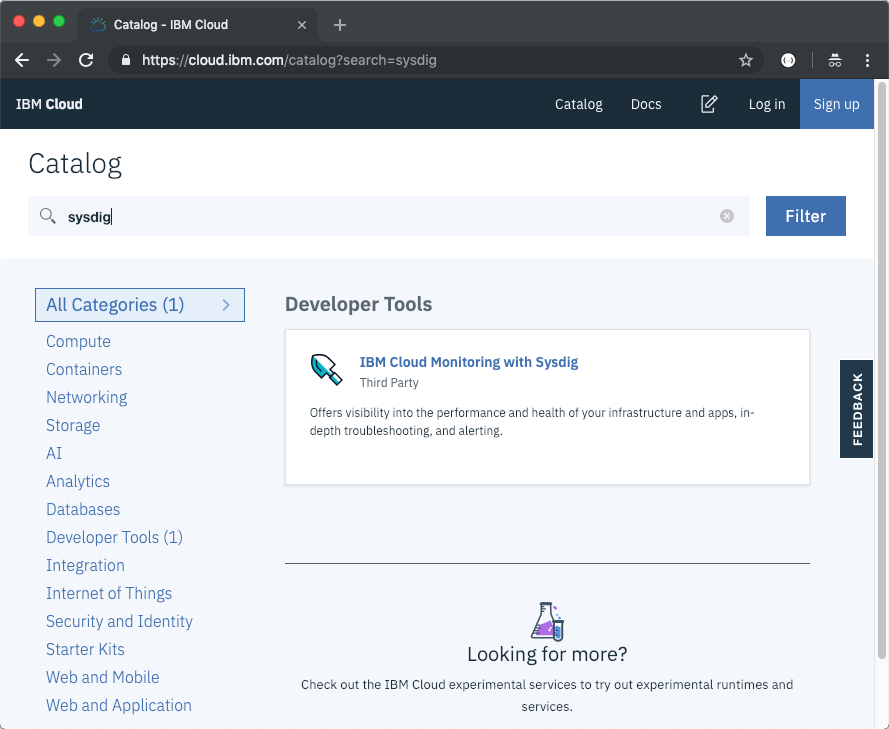
- Create an instance of IBM Cloud Monitoring with Sysdig from the catalog:
- Set the Service name to YOUR_IBM_ID-sysdig.
- Select the location where your cluster is created. If the location is not in the list, pick Dallas (us-south).
- Use the default resource group.
- Click Create.
- In the Observability category, under Monitoring, locate the service instance you created.
- Click View access keys and copy your access key as it will be needed in later steps.
Configure your cluster with Sysdig
Create a service account called sysdig-agent to monitor the kubernetes cluster:
kubectl create serviceaccount sysdig-agentAdd a secret to your Kubernetes cluster:
kubectl create secret generic sysdig-agent --from-literal=access-key=SYSDIG_ACCESS_KEYThe SYSDIG_ACCESS_KEY is the access key copied earlier.
Download the sysdig-agent-clusterrole.yaml.
Add the Sysdig agent cluster role:
kubectl apply -f sysdig-agent-clusterrole.yamlAdd a cluster role binding:
kubectl create clusterrolebinding sysdig-agent --clusterrole=sysdig-agent --serviceaccount=default:sysdig-agentDownload the sysdig-agent-configmap.yaml.
Edit the
sysdig-agent-configmap.yamland add required parameters for configuring the agent to work in the IBM Cloud:- k8s_cluster_name: This parameter specifies the cluster name as a metric label. You can use the label kubernetes.cluster.name to navigate the Kubernetes dashboards by cluster name and filter out metrics associated with the cluster.
- collector: This parameter specifies the ingestion URL for the region where the monitoring instance is available.
- collector_port: This parameter indicates the port on which the collector is listening on. It's value must be 6443.
- ssl: This parameter must be set to true.
- ssl_verfiy_certificate: This parameter must be set to true.
- new_k8s: This parameter must be set to true to capture kube state metrics.
- sysdig_capture_enabled: This parameter enables or disables the Sysdig capture feature. By default is set to true.
An example yaml file looks like this:
apiVersion: v1
kind: ConfigMap
metadata:
name: sysdig-agent
data:
dragent.yaml: |
  ### Agent tags
  tags: linux:ubuntu,dept:dev,local:nyc
  #### Sysdig Software related config ####

  # Sysdig collector address
  collector: us-south.monitoring.cloud.ibm.com

  # Collector TCP port
  collector_port: 6443

  # Whether collector accepts ssl
  ssl: true

  # collector certificate validation
  ssl_verify_certificate: true

  #######################################
  new_k8s: true
  k8s_cluster_name: lab-1

  sysdig_capture_enabled: false
Apply the config map to the cluster:
kubectl apply -f sysdig-agent-configmap.yaml- Download the sysdig-agent-daemonset-v2.yaml.
- Apply the daemonset to deploy the Sysdig agent to the cluster. Run the following command:
kubectl apply -f sysdig-agent-daemonset-v2.yaml
View metrics with Sysdig
- Click View Sysdig to open the Sysdig console
- In the Sysdig Welcome wizard
- Select Kubernetes as the installation method.
- It should show one or more agents already connected.
- Select GO TO NEXT STEP.
- And finally LET'S GET STARTED
Navigate the Sysdig console to get metrics on your Kubernetes cluster, nodes, deployments, pods, containers.
- Under Explore, select Containerized Apps to view raw metrics for all workloads running on the cluster.
- Under Dashboard, select My Shared Dashboards / HTTP Overview to get a global view of the cluster HTTP load.
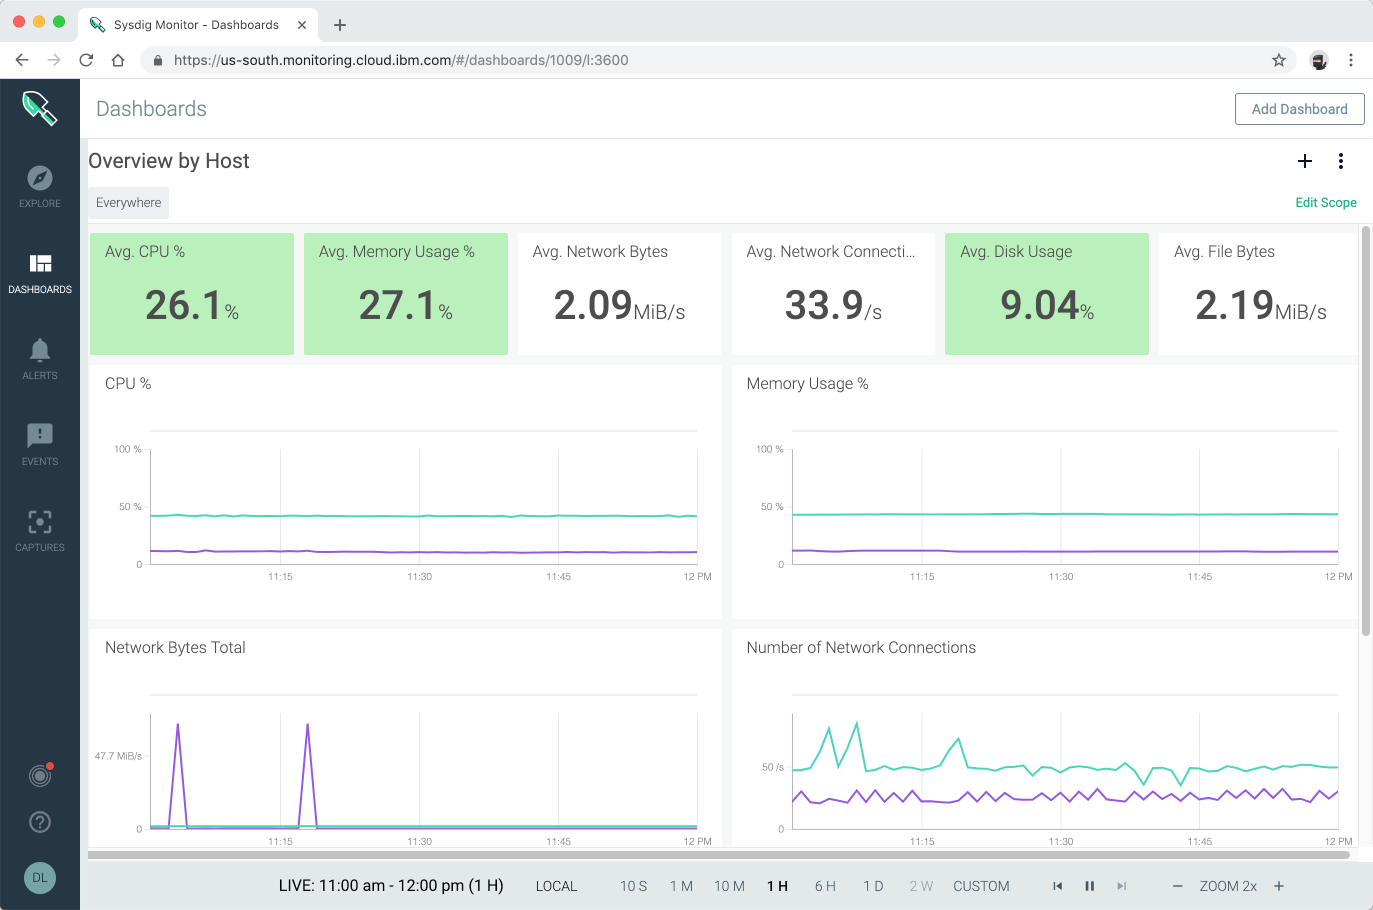
- Under Dashboard, select My Shared Dashboards / Overview by Host to understand how nodes are currently performing.
If Kubernetes-specific views do not show data, wait till your cluster starts sending metrics to Sysdig and refresh the Sysdig monitor console.
Find more about IBM Cloud Monitoring with Sysdig in the IBM Cloud documentation.